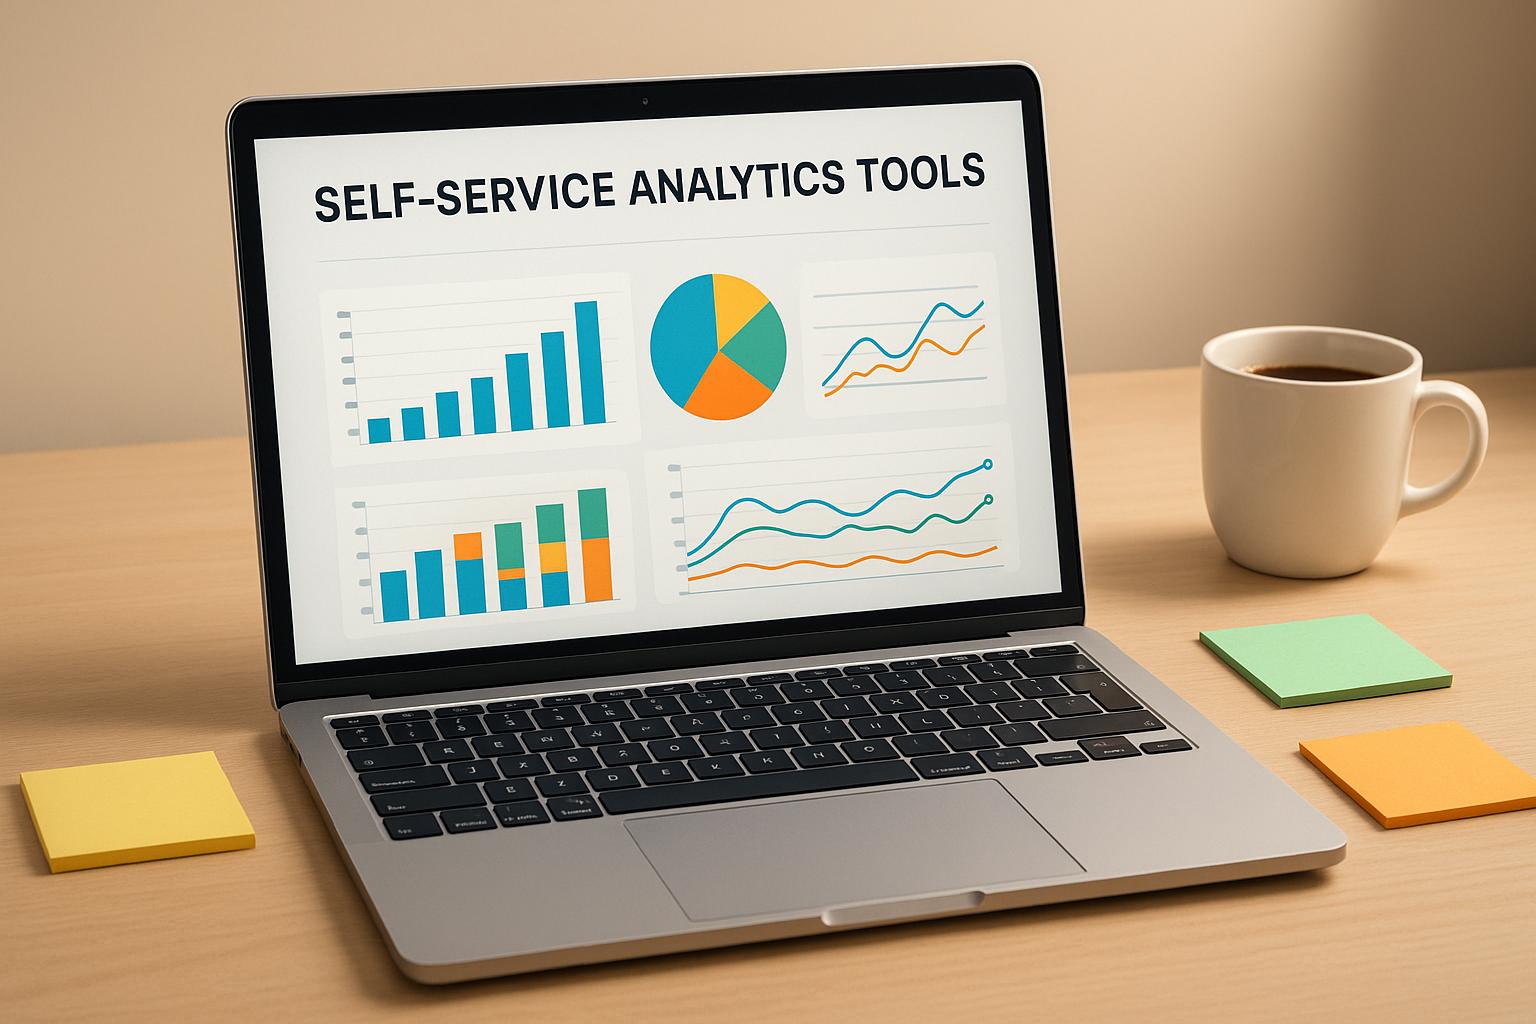
Self-service analytics tools make it simpler for teams to analyze data without needing technical expertise. They help businesses create dashboards, visualize trends, and make decisions faster. However, choosing the right tool depends on factors like ease of use, integration options, scalability, and cost.
Here’s a quick breakdown of the top tools:
Quick Comparison:
| Tool | Best For | Ease of Use | Integration Options | Cost Range |
|---|---|---|---|---|
| Power BI | General analytics | Easy for Microsoft users | Strong with Microsoft | $10–$20/user/month |
| Tableau | Data visualization | Intuitive but pricier | Broad platform support | $70–$150/user/month |
| Looker | Data governance | Steeper learning curve | Cloud platforms, databases | Custom pricing |
| Qlik Sense | Data exploration | Moderate learning curve | Wide data source support | $30–$50/user/month |
| Zoho Analytics | Small businesses | Simple and affordable | Excellent within Zoho | $5–$45/user/month |
| Row Zero | Spreadsheet users | Familiar interface | Limited but growing | $20–$50/user/month |
| Amplitude/Heap | Behavioral analytics | Easy setup (Heap), Moderate (Amplitude) | Product-focused tools | Usage-based pricing |
Choosing the right tool depends on your team’s needs, data complexity, and budget. For small teams, Zoho Analytics or Power BI are cost-effective. For advanced visualizations, Tableau excels. If data governance or behavioral insights are priorities, Looker or Amplitude/Heap might fit better.
Microsoft Power BI is a self-service analytics platform designed to meet the needs of businesses across the U.S. Its strong integration with the Microsoft ecosystem makes it an excellent choice for organizations already working with Windows-based systems and Office 365 tools.
Usability: Power BI provides a user-friendly drag-and-drop interface, enabling even those without technical expertise to create reports. The platform is made up of three core components: Power BI Desktop for building reports, Power BI Service for cloud-based collaboration, and Power BI Mobile for access on the go. Users can connect to a wide variety of data sources, clean and transform data using Power Query, and craft interactive dashboards with a visual editor that feels familiar to those who use Excel. This familiarity, combined with its seamless integration across systems, makes Power BI a powerful tool for businesses.
One of the platform’s standout features is its integration capabilities. Power BI connects at multiple levels - organization-wide, department-specific, or for individual reports [1]. Within the Microsoft 365 suite, it works seamlessly with Excel through the "Analyze in Excel" feature, embeds live reports into PowerPoint slides, and syncs with OneDrive and SharePoint for automatic updates and secure sharing. Through Microsoft Teams, users can access reports directly in channels, embed dashboards in meetings, and set up automatic notifications [1].
For Azure users, Power BI integrates with services like SQL Database, HDInsight, Blob Storage, Synapse Analytics, and Data Lake Storage Gen2. It also connects with Azure AI Services, Azure Machine Learning, and Azure Log Analytics for advanced analytics [1][2]. Beyond Microsoft, Power BI supports custom connectors and APIs, enabling integration with Python and R for tailored visualizations, geospatial tools like ArcGIS and Azure Maps, and third-party software through specialized connectors [1].
Scalability is another major advantage. Power BI supports businesses of all sizes, offering tiers that range from shared resources for small teams to dedicated Premium capacities for larger enterprises. For companies looking to embed analytics directly into their applications, Power BI Embedded provides a dedicated Azure resource [1][2].
Security is a priority in Power BI's design. It incorporates Azure Information Protection for data classification, uses Azure Private Link for secure network connections, and includes robust row-level security controls. It also offers single sign-on through Azure Active Directory and adheres to key U.S. regulatory standards, ensuring enterprise-level data protection.
In today’s data-driven world, clear and effective visualization plays a pivotal role in helping businesses make informed decisions. Tableau stands out as a powerful tool for turning complex datasets into easy-to-understand visual insights. For U.S. companies focused on data visualization, Tableau offers a solution that combines functionality with user accessibility.
Ease of Use is one of Tableau’s standout features. Its drag-and-drop interface and the Show Me tool make it simple to create professional-grade visualizations without needing programming skills. Tableau Desktop acts as the main hub for building visualizations, while Tableau Server facilitates sharing and collaboration at the enterprise level. Whether connecting to live data sources or working with extracted data for better performance, Tableau provides flexibility to suit various business requirements. This user-friendly approach also ensures smooth integration with a wide range of data sources.
Tableau’s real strength lies in its ability to handle intricate data relationships and create interactive dashboards that invite deeper exploration. With features like calculated fields, parameters, and built-in analytics, users can perform statistical analysis directly within their visualizations. This makes Tableau especially effective for presenting insights to executives, clients, or stakeholders who prefer visuals over rows of numbers.
Integration Capabilities are another key advantage. Tableau connects seamlessly with a variety of platforms, including cloud services like AWS, Google Cloud, and Microsoft Azure; major databases like Oracle, SQL Server, MySQL, and PostgreSQL; and data warehouses such as Snowflake, Redshift, and BigQuery. For custom needs, it supports integrations via REST APIs and web data connectors. If your company uses Salesforce, you’ll find the integration particularly smooth, thanks to Salesforce’s acquisition of Tableau in 2019.
Scalability is designed to meet both technical and organizational growth. Tableau Server allows deployment either on-premises or in the cloud, supporting thousands of users with centralized management of permissions and data. It also offers features like incremental data refreshes to maintain performance as data volumes grow. For businesses looking for a cloud-native option, Tableau Online provides similar functionality without the hassle of managing infrastructure. This scalability is paired with strong security measures, ensuring reliability for enterprise-level analytics.
Security and Compliance are built into Tableau’s design, aligning with U.S. regulatory standards. The platform supports single sign-on via Active Directory and SAML, row-level security to control data access, and encryption for data both in transit and at rest. It meets SOC 2 Type II compliance standards and offers audit logging, making it suitable for industries with strict regulatory requirements.
Costs reflect Tableau’s position as a high-end analytics solution. Pricing starts at $75/month for a Creator license, $42/month for an Explorer license, and $15/month for a Viewer license. While the initial learning curve can be challenging, Tableau offers plenty of training resources and a strong user community to help new users get up to speed. For businesses that need advanced visualization capabilities without sacrificing performance, Tableau proves to be a strategic investment.
In 2020, Google added Looker to its Cloud analytics ecosystem, bringing a fresh approach to business intelligence. Unlike traditional drag-and-drop tools, Looker uses a model-driven architecture, offering a balance of technical depth and user-friendly features. For U.S. businesses aiming to modernize their analytics, Looker stands out as a powerful option.
Ease of Use
At the heart of Looker is LookML, a modeling language that defines data relationships and business logic through code. While setting up LookML requires technical expertise, it ensures consistent data definitions across the organization. Once the groundwork is laid, business users can easily explore data through Looker's web interface without worrying about incorrect joins or inconsistent metrics.
The learning curve for LookML can be steep, especially for teams lacking dedicated data engineers. However, the structured approach often proves worth the effort, as it creates a unified foundation for data exploration. This consistency also enables smooth integration with various data ecosystems, enhancing overall usability.
Integration Capabilities
Looker excels in integration, connecting seamlessly with major databases and Google services. It works natively with Google Cloud tools like Google BigQuery, Google Analytics, and Google Ads, while also supporting popular databases such as Amazon Redshift, Snowflake, Microsoft SQL Server, Oracle, PostgreSQL, and MySQL. Additionally, Looker provides REST APIs for custom integrations and can embed analytics directly into other applications.
Scalability
One of Looker's strengths is its ability to handle large datasets efficiently. Its architecture separates data modeling from querying, with LookML defining relationships at the semantic layer. This setup allows the platform to process complex queries across multiple data sources without requiring users to understand the database structure. By distributing queries and optimizing load management, Looker ensures smooth performance even for organizations with extensive data needs. This centralized modeling approach also helps maintain consistent governance across departments.
Security and Compliance
Looker is built with enterprise-grade security in mind, adhering to U.S. regulatory standards. It includes role-based access controls, single sign-on integration with Active Directory and SAML providers, and row-level security to restrict access to sensitive data. Data is encrypted both in transit and at rest, and user activity is logged for auditing purposes. Looker meets SOC 2 Type II standards and benefits from Google Cloud’s additional certifications, supporting compliance with HIPAA for healthcare organizations and FedRAMP for government contractors.
Costs
Looker uses a per-user pricing model, which aligns with its enterprise focus. However, the lack of transparent pricing can make budgeting tricky for smaller businesses. Costs scale based on user count and feature needs. While the initial investment in LookML modeling might seem high, many organizations find that it reduces long-term maintenance expenses and eliminates reporting inconsistencies across teams, making it a worthwhile choice for those prioritizing data accuracy and governance.
Qlik Sense sets itself apart with its associative data engine, allowing users to explore data without being confined to predefined drill-down paths. This flexibility is especially useful for U.S. businesses that require adaptive data exploration tools.
Qlik Sense features a drag-and-drop interface that makes it user-friendly, even for individuals without technical expertise. Its associative model keeps data relationships intact, enabling users to click on a value and instantly see its connections across all visualizations. This eliminates the need for pre-set queries or complex joins.
The platform also includes a Smart Search feature, where users can type natural language queries like "sales in California last quarter" to generate relevant visualizations. While simple tasks are easy to perform, creating advanced dashboards does require some familiarity with Qlik's distinct data modeling approach. To help users get up to speed, the platform offers guided tutorials and an extensive Help system. These resources make it easier to integrate Qlik Sense with various data sources.
Qlik Sense connects to over 100 data sources right out of the box. It supports major databases like Oracle, SQL Server, MySQL, and PostgreSQL and works seamlessly with cloud platforms such as Amazon Web Services, Microsoft Azure, and Google Cloud Platform. Additionally, it supports REST APIs, ODBC/JDBC connections, and can integrate with SaaS applications like Salesforce, SAP, and Microsoft Dynamics.
For more tailored needs, Qlik provides configurable REST and web connectors, as well as real-time data streaming via Apache Kafka, making it possible to analyze data as it flows into the system.
Thanks to its in-memory processing and columnar storage architecture, Qlik Sense can handle datasets from a few thousand to billions of rows with ease. Its data compression technology reduces storage requirements by up to 90%, enabling faster in-memory operations.
The platform supports multi-cloud deployment options, including on-premises, cloud, and hybrid setups. With elastic scaling, it adjusts resources dynamically based on user demand, ensuring smooth performance even during peak usage. For larger enterprises, Qlik Sense offers load balancing across multiple servers and allows data processing to be distributed across different geographic locations.
Qlik Sense prioritizes security with SOC 2 Type II certification and ISO 27001 compliance, meeting rigorous U.S. standards. The platform offers row-level security, which restricts data access based on user roles, and Section Access controls, providing detailed permissions at the field and sheet levels.
Data is protected with AES-256 encryption, both in transit and at rest. The platform integrates with Active Directory, SAML, and OAuth for single sign-on functionality. For industries with specific requirements, such as healthcare and government, Qlik Sense supports HIPAA compliance and offers FedRAMP-authorized cloud deployments through AWS.
Qlik Sense provides flexible pricing options to suit businesses of different sizes. The Professional tier starts at approximately $30 per user per month (billed annually), while the Analyzer tier, designed for view-only users, costs around $15 per user per month. For larger enterprises, pricing scales based on user count and feature needs, with advanced governance tools included in higher tiers.
Unlike some competitors, Qlik Sense does not charge based on data volume or query frequency, making it a budget-friendly option for organizations with large datasets or heavy usage. Additionally, the platform offers capacity-based licensing, which is ideal for scenarios like customer-facing analytics where user-based pricing may not be practical.

Zoho Analytics stands out as a budget-friendly option for U.S. businesses seeking robust analytics without the overwhelming complexity of enterprise-level tools. It integrates effortlessly with both Zoho's own ecosystem and a wide range of external data sources, making it a great fit for small to medium-sized businesses.
Zoho Analytics makes navigating and creating reports straightforward, thanks to its drag-and-drop interface. Its AI-powered Smart Assistant can transform plain English queries into visual insights. For example, you could ask, "What were our top-selling products in Q3?" and instantly receive a clear visualization.
The platform's Report Builder simplifies dashboard creation with step-by-step guidance, while pre-designed templates tailored to common business needs help users get started quickly. For those new to analytics, Zoho provides contextual help and interactive tutorials embedded right within the platform. Plus, its collaborative tools let teams work together on reports in real time, complete with commenting and sharing features to keep workflows smooth.
Zoho Analytics connects with over 250 data sources, including popular databases like MySQL, PostgreSQL, and Microsoft SQL Server. It also integrates seamlessly with major cloud platforms and works particularly well within the Zoho ecosystem, syncing effortlessly with tools like Zoho CRM, Books, and Projects.
The platform also supports connections to Salesforce, Google Analytics, Facebook Ads, and QuickBooks via pre-built connectors. For businesses with unique needs, Zoho offers REST APIs and webhook support for custom integrations. With real-time data synchronization and customizable automated refresh schedules, you can be confident your dashboards always display up-to-date information.
Zoho Analytics is designed to handle large datasets efficiently, even as your data grows. Using columnar storage and in-memory processing, it delivers fast query performance. Its auto-scaling infrastructure adjusts resources dynamically based on usage, ensuring smooth operation.
The platform supports multi-tenant architecture, allowing businesses to create separate workspaces for departments or clients. It also offers white-label solutions, enabling businesses to embed analytics into their own applications. Dashboards are optimized for all devices, making it a great choice for remote and hybrid work setups.
Zoho Analytics prioritizes security, holding SOC 2 Type II certification and adhering to ISO 27001 standards to meet strict U.S. security requirements. It features role-based access controls, letting administrators manage permissions at the row, column, and dashboard levels.
Data is safeguarded with AES-256 encryption and SSL/TLS-secured communications. The platform supports single sign-on (SSO) via SAML and integrates with Active Directory for enterprise authentication. For businesses dealing with sensitive information, Zoho provides audit trails to track user activity and data access, ensuring compliance with regulations like GDPR and CCPA.
Zoho Analytics offers affordable pricing in the self-service analytics space. The Basic plan starts at $22 per month for up to 2 users, while the Standard plan costs $45 per month for up to 5 users. The Premium plan, at $112 per month for up to 15 users, includes advanced features like white-labeling and custom domains.
Unlike many competitors, Zoho's pricing is based on the number of users rather than data volume, making it an appealing option for small businesses managing large datasets. They also offer a 15-day free trial and discounts for existing Zoho customers. For larger teams, custom enterprise pricing is available with volume discounts to help reduce per-user costs.
Row Zero takes self-service analytics to the next level by combining the familiar feel of traditional spreadsheets with the power and security of enterprise-grade data tools. Mark Tressler describes it as:
"an enterprise-grade spreadsheet that works like Excel and Google Sheets but has the big data power, connectivity, and security of modern BI tools" [3].
This combination of ease of use and advanced capabilities makes it a standout option for businesses looking to streamline data analysis. Let’s dive into its features like usability, integrations, scalability, and security.
One of Row Zero's biggest strengths is its user-friendly interface, which mirrors the look and feel of Excel and Google Sheets. This makes it an excellent choice for finance teams, analysts, and other professionals already comfortable with traditional spreadsheets.
What sets Row Zero apart is its high-performance spreadsheet engine. It processes large datasets much faster than Excel, enabling users to perform complex calculations, create pivot tables, and generate charts with ease. These familiar tasks are not only simpler but also significantly faster, making it a valuable tool for handling heavy data workloads [3].
Row Zero seamlessly connects to data warehouses and databases, eliminating the need for manual imports. With secure OAuth connections, users can work with live, real-time data directly from their company’s infrastructure.
This direct connection ensures that the data is always current, reducing the risk of errors and saving time. By integrating with existing systems, Row Zero makes it easy to analyze and act on up-to-date information.
When it comes to handling large datasets, Row Zero leaves traditional spreadsheet tools in the dust. The platform supports billion-row spreadsheets on its Enterprise plans, which is a staggering 1,000 times more than Excel's capacity [3]. This means businesses can analyze entire datasets without needing to rely on sampling or aggregation.
Thanks to its scalable cloud infrastructure, Row Zero adjusts automatically to accommodate growing data volumes. This ensures that performance remains smooth and reliable, no matter how large or complex the dataset becomes.
Security is a top priority for Row Zero. Organizations can control data sharing by restricting exports, copy/paste functions, and other actions that might lead to accidental data leaks. Importantly, all data processed by Row Zero remains in the cloud and is region-locked [3], helping businesses comply with data residency regulations.
The platform includes single sign-on (SSO) integration, allowing users to securely access data using their company credentials. Additionally, workbooks inherit row-level security directly from the data warehouse, meaning users only see the data they’re authorized to view. Row Zero also meets stringent security standards, including HIPAA and SOC 2 compliance [3], making it a reliable choice for handling sensitive information.
Row Zero provides a free trial for users to explore its features. For businesses, enterprise plans are available with pricing structured around usage and specific organizational needs [3].
Amplitude and Heap take different approaches when it comes to analyzing user behavior, each offering unique strengths in how they collect and interpret user interaction data.
Heap employs a Smart Capture system that automatically records every user interaction without requiring predefined events[4]. This means you can retroactively define or redefine events, making it easier to analyze historical data.
Amplitude, on the other hand, relies on manually defining events during the setup process. While it now includes an "autocapture lite" feature through its browser SDK for basic interactions, its strength lies in its deliberate and customizable setup. This approach prioritizes data accuracy and governance but limits retroactive analysis.
Heap shines when it comes to retroactive analysis. It allows businesses to define events even after they've occurred. Amplitude, however, requires events to be predefined, focusing on intentional data collection to ensure high-quality insights.
Heap offers a simple, tag-free setup with just one code snippet. This makes it accessible to non-technical users and minimizes the need for engineering support. Amplitude, while requiring more technical effort during setup, provides a user-friendly interface once configured, making it suitable for detailed and advanced analysis.
Both platforms integrate well with other tools and are built to scale, but they cater to slightly different needs:
Amplitude emphasizes strong data governance, offering tools to define event taxonomies and monitor data quality. Its autocapture settings can also be adjusted to meet compliance requirements. Heap, while designed to protect privacy by avoiding sensitive data inputs, collects a large volume of data through its autocapture system. This requires careful organization to maintain clarity and compliance.
| Platform | Free Tier | Paid Plans | Enterprise |
|---|---|---|---|
| Amplitude | Up to 10 million events/month, 90 days retention | Growth plan (custom pricing), 14-day trial | Custom pricing with advanced governance |
| Heap | Up to 10,000 user sessions/month, 6 months storage | Starting around $3,600/year, 14-day trial | Custom pricing based on sessions |
Amplitude also provides free annual subscriptions for qualifying startups and specific programs. For advanced plans, both platforms require consultation with their sales teams to customize pricing based on data volume and feature needs.
Every self-service analytics tool has its own set of strengths and trade-offs. Knowing these can help you choose the right tool based on your organization’s specific needs and limitations.
Microsoft Power BI is well-known for its affordable pricing and seamless integration with the Microsoft ecosystem. If your organization already uses Office 365 or Azure, you’ll appreciate its connectivity and familiar interface. However, its visualization options might feel limited compared to more specialized tools, and advanced data modeling often requires technical expertise.
Tableau is a leader in data visualization, offering unmatched capabilities in this area. Its drag-and-drop interface allows non-technical users to explore data with ease and creativity. That said, its higher pricing and potential performance issues with large datasets (if not optimized) can be drawbacks.
Looker shines when it comes to data governance and maintaining consistent metrics across teams. Using LookML ensures everyone works with the same definitions, reducing discrepancies. However, LookML’s learning curve can be steep, and the platform requires a significant initial investment in data modeling.
Qlik Sense takes a different approach with its associative analytics, which highlights relationships in data that might otherwise go unnoticed. Its in-memory processing ensures fast performance, particularly for exploratory analysis. On the downside, the associative model can feel overwhelming for users accustomed to standard filters, and advanced features often require scripting knowledge.
Zoho Analytics is a favorite among small businesses, offering great value with comprehensive features at a low cost. Its integration with other Zoho products creates a unified experience. However, it lacks the scalability and advanced analytics capabilities needed for larger enterprises.
Row Zero appeals to Excel power users, offering a spreadsheet-like experience for big data analysis. It handles large datasets that would overwhelm traditional spreadsheets while retaining familiar formulas and functions. That said, its visualization options and collaboration features are limited, making it less ideal for team-based or presentation needs.
Amplitude and Heap specialize in behavioral analytics, providing deep insights into user journeys. Heap’s automatic event tracking simplifies setup, while Amplitude excels in cohort and retention analysis. However, their focus on user behavior makes them less suitable for broader business intelligence purposes.
Here’s a quick comparison of these platforms:
| Platform | Usability | Integrations | Scalability | Security | Pricing |
|---|---|---|---|---|---|
| Power BI | Great for Microsoft users | Excellent with Microsoft stack | High | Enterprise-grade | Low ($10-20/user/month) |
| Tableau | Outstanding for visualization | Very good across platforms | High | Enterprise-grade | High ($70-150/user/month) |
| Looker | Moderate learning curve | Good with cloud platforms | Very high | Excellent governance | High (custom pricing) |
| Qlik Sense | Good once learned | Good across platforms | High | Enterprise-grade | Moderate ($30-50/user/month) |
| Zoho Analytics | Very user-friendly | Excellent with Zoho suite | Moderate | Good | Very low ($5-45/user/month) |
| Row Zero | Ideal for Excel users | Limited but growing | High for data volume | Good | Moderate ($20-50/user/month) |
| Amplitude/Heap | Great for specific use cases | Good with product tools | High | Good | Moderate (usage-based) |
For those on a budget, Power BI and Zoho Analytics are excellent choices. On the other hand, platforms like Tableau and Looker justify their higher price tags with advanced features, making them ideal for data-driven organizations. Keep in mind that usage-based platforms like Amplitude and Heap can become costly as your user base grows, so it’s important to monitor expenses.
In terms of security, enterprise-level tools like Tableau, Looker, and Power BI offer robust features such as row-level security, audit trails, and compliance certifications. Smaller platforms like Zoho Analytics and Row Zero provide adequate security for most use cases but may lack the advanced governance features required in heavily regulated industries.
Self-service analytics tools give every team member the ability to make smarter, data-driven decisions. But choosing the right platform comes down to understanding your specific needs, budget, and technical expertise.
For small businesses, tools like Zoho Analytics or Microsoft Power BI offer essential features at a lower cost, making them great budget-friendly options. Mid-sized companies often turn to platforms like Qlik Sense or Tableau, which shine when advanced visualizations and in-depth data exploration are priorities. Larger enterprises should prioritize scalability and governance, with platforms like Looker ensuring consistent data management across teams and Tableau excelling in delivering high-level visual insights.
Your technical requirements also play a big role. Teams already proficient in Excel might find tools like Row Zero an easy step up to handling big data. On the other hand, if your focus is product analytics, specialized tools like Amplitude or Heap are better suited for digging into user behavior - something general-purpose platforms may struggle to deliver.
Don’t forget to consider compliance and security needs. Highly regulated industries often require enterprise-grade solutions like Tableau, Looker, or Power BI, which come with advanced security features. For less regulated environments, more affordable tools with basic security can often get the job done.
Implementation is another critical piece of the puzzle. Many organizations face challenges with data integration, user adoption, and optimization. Partnering with experts like Octaria can simplify the process, especially if you need custom integrations or AWS-based data architectures. Their experience in building scalable solutions can help you get the most out of your analytics platform. Plus, ongoing training and support ensure long-term success.
Ultimately, the best analytics tool is the one your team will actually use - and use consistently. Consider factors like training, support, and scalability to make a choice that drives better decisions and delivers real results over time.
When selecting a self-service analytics tool, prioritize ease of use, particularly for team members who may not have a technical background. The tool should connect effortlessly with your existing data sources and have the capacity to expand as your business grows.
Key features to consider include solid security and governance, effective collaboration capabilities, and versatile data visualization tools. A platform that allows for flexible, iterative analysis can help your team make quicker, informed decisions. Choose a solution that aligns with your business goals and technical needs to get the most out of your investment.
Integration features in tools like Power BI and Tableau are game-changers for businesses looking to enhance their analytics and decision-making processes. Power BI stands out with its ability to support teamwork through shared goals, real-time collaboration tools, and AI-powered capabilities like Copilot. These features make it especially useful in fast-moving environments where quick, informed decisions are essential.
Tableau, on the other hand, shines with its seamless connections to third-party applications and advanced data modeling options. This flexibility allows for more tailored deployments and deeper analytical insights, making it a strong choice for organizations that need versatile and detailed data handling.
The integration capabilities of both tools help businesses refine their workflows, encourage collaboration, and tailor analytics to meet specific needs. From automating tedious tasks to enabling real-time data sharing and collaborative analysis, Power BI and Tableau provide the resources companies need to make smarter, data-driven decisions with greater efficiency.
Both Looker and Qlik Sense are built to manage large datasets efficiently and offer strong scalability options. Looker focuses on performance by fine-tuning data models and simplifying dashboard designs, ensuring it can handle significant data volumes smoothly when configured correctly. On the other hand, Qlik Sense uses in-memory processing and data compression to quickly process and retrieve large datasets, even in high-demand situations.
When it comes to scaling, both platforms provide practical solutions like optimizing data models, increasing system resources (like adding more RAM), and using data filtering techniques. These capabilities make them dependable tools for handling and scaling large datasets across various business needs.
Let's level up your business together.
Our friendly team would love to hear from you.
